| home | LSF Levels | Galleries | Links | Jerilderie | Resources |
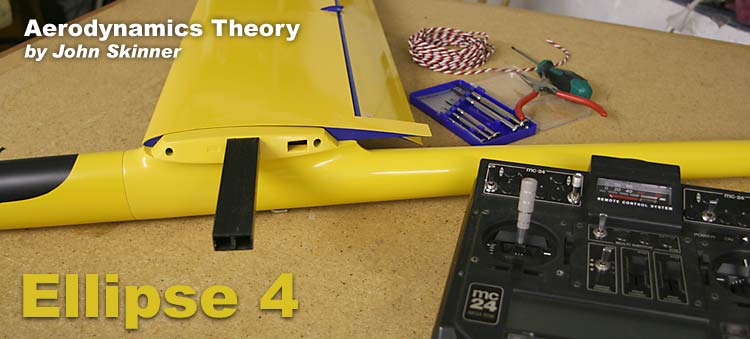
John Skinner
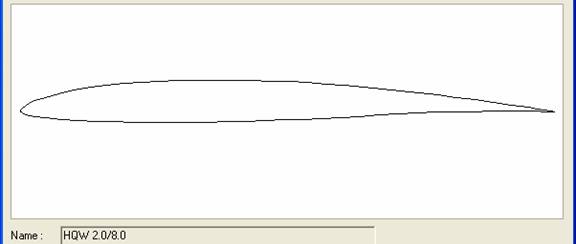
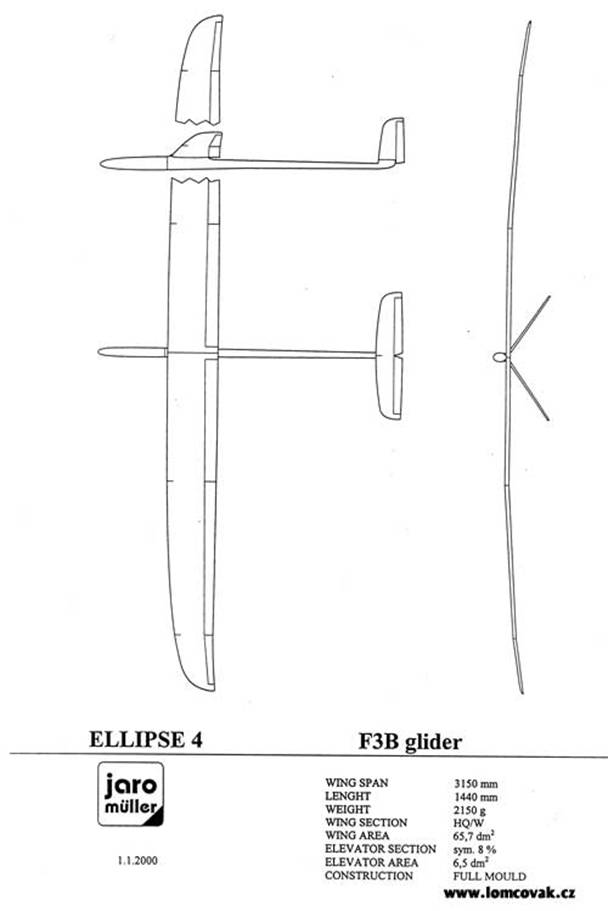
This is a theoretical analysis of the aerodynamics of the HQW 2.0-8 profile as it applies to the Jaro Muller Ellipse 4. I thought it might be useful to a friend of mine who has one of these gliders and is in the process of optimizing performance. I have utilized a similar approach to get an idea of flap positions that are appropriate for my Nyx and Caracho 3000 and have found that the theory and practice agree pretty closely. The document started out as a note with a few screen dumps from profili. I decided though that I should do a bit better and take it to a standard to allow a wider audience. I don’t have a degree in aerodynamics, all that I have learned in this subject comes from the experiences of 25 years in aeromodelling, therefore any guidance, comments, criticisms and suggestions on the following would be gratefully appreciated and help my understanding. The Ellipse 4 is an F3b/F3j model, and the HQW 2.0-8 is designed for variable camber. The analysis revolves around the F3b triple task of speed, distance and duration. The appropriate flap settings for each of these tasks is discussed, and in addition an analysis of turn performance in speed, and launch performance. Note that when I refer to flap I mean raising or lowering the whole trailing edge, flaps and ailerons, to create variable camber on the wing. The material is not overly complicated, and I try to explain some of the concepts involved along the way. There are plenty of references available on the subject, but I would recommend Martin Simons’ book “Model Aircraft Aerodynamics” The aerodynamic calculations utilized Profili 2.19 Pro at www.profili2.com and Excel spreadsheets. The dimensions for the Ellipse 4 can be found at www.aerodesign.de or Jaro Muller Ellipse 4.
Basic Assumptions:
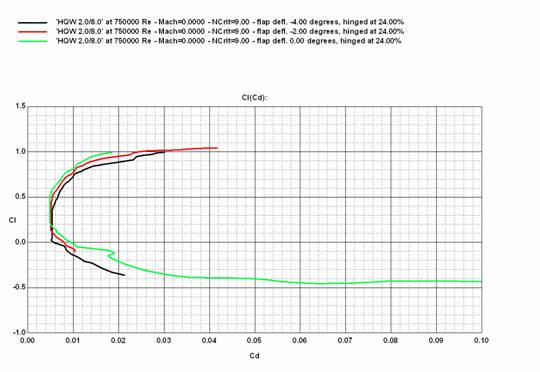
What flap setting to use for speed? Assuming a speed of 166 km/hr, Reynolds number at the wing root is 750,000, weight is 2750g (Ballasted). CL is 0.03. In speed, low drag at CL 0 or slightly above is important for good acceleration in the dive, high straight-line speed and energy retention when flying the legs between bases. Let’s look at some polars drawn by Profili:
Polar 1: HQW 2.0-8, Re 750,000, Flap at -4°, -2°, 0°
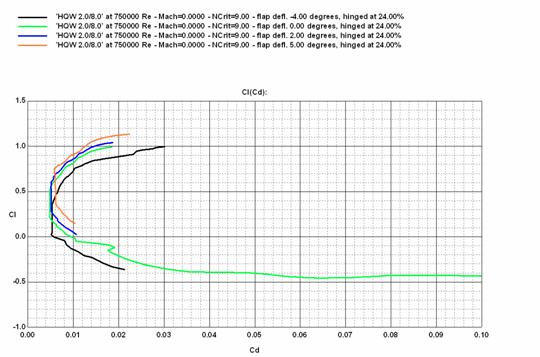
What flap setting is needed to help with turns at speed, and what is the importance of snap flap? To turn, the aerofoil needs to be able to produce high CL with low drag. To appreciate the importance of high CL performance, consider the table below:
Notes: Assumes that turn is in the horizontal plane, Model speed 166 km/hr, weight 2750g, wing area 65.7dm². The apparent weight is related to the model mass, velocity and turn diameter using the centripetal acceleration formula F=mv²/r. The CL required to support this mass can be calculated using the lift formula (see appendix). Time spent in the turn is a result of the distance traveled 3/2 x pi x D and estimated constant 166 km/hr airspeed. Tight turn diameter is important for fast times, for example, everything else equal, the difference between 15m and 25m diameter turns is about 1.3 seconds over the whole course! We need an aerofoil that is able to give high CL. We can plot the turn diameter versus the CL required:
The CL requirement of the aerofoil rapidly increases at tighter turn diameters. There is a diminishing return for the time saved in the turn, especially when we put constraints on the maximum CL an aerofoil can give. Fast airfoils have problems giving high lift at low drag - even flapped we could not expect much more than around CL 1.1, indicating a best turn diameter at around 13m, time for three turns is 1.3 seconds. We haven’t yet taken into account the drag the aerofoil gives at these high CL values, and therefore slowing the glider in the turn, then exiting for the next lap at a lower speed. Intuitively, low drag at high CL is important as well. Looking now at the Profili polars:
Polar 2: HQW 2.0-8, Re 750,000, Flap at -4°, 0°, +2° and +5°
In practice, the turn is started by a pull of up elevator to increase CL. More elevator, the tighter the turn and the higher the CL. All of this implies that the movement of flap with the pull of up elevator stick should be geared correctly. I have not considered the trade-off between turn diameter and speed loss (can anyone help with this?) The best flap setting for turning is dependant on the CL range that we are requiring from the aerofoil. Summary for speed:
As a result of drag, there is a trade-off between turn diameter and speed loss.
What flap setting to use for Distance? For distance, the model is flown on the same course as in speed, except that the glider must complete as many laps as possible in 4 minutes. In practice, the model is rarely flown at a constant speed within one flight, depending on the air, the number of laps can change radically. Assuming 2600g weight:
For flying the number of legs shown above at constant speed, we are seeking the flap setting that gives minimum drag at around the range of CL 0.15 – 0.67. Looking again at Profili, here’s the polar for 30 lap pace: 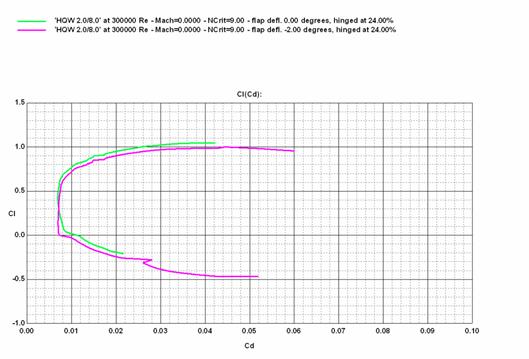 Polar3:HQW 2.0-8, Re300,000, Flap at -2, +0°
At 20 lap pace the airfoil polar looks like this:
Polar4: HQW 2.0-8, Re200,000, Flap at -2, +0°
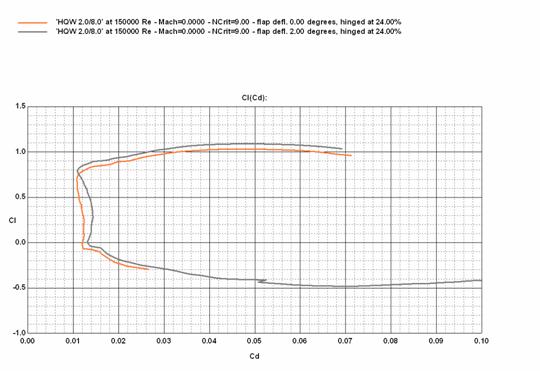
And now the polar for 13 laps:
Polar5: HQW 2.0-8, Re 150,000, Flap at 0, +2°
Summary for Distance:
What is the best setting for thermal? For still air performance, we need low drag at high CL. The wing loading, and aspect ratio are important as well. Thermal speeds are generally just above the stall speed, although with modern sections sometimes a little faster. Let’s assume a speed of around 27km/hr, so Reynolds number is around 110,000 at the mean wing chord. Weight is assumed to be 2200g, so CL required is 0.92. Applying Profili again:
Polar6:HQW 2.0-8, Re 110,000, Flap at 0, +2° and +5°
These are all very low speeds; any slower and the model stalls! The polar curve is very sharp at these high CL values, with the “sharpness” increasing as flap is deflected further. The speed difference between optimum flap settings is very close and therefore probably unusable to minimize sink rate as any small variation in speed either slower or faster will quickly increase the drag. The best may well be to run 0° flap with elevator to flap coupling to maintain low drag during the thermal turn. This is speculation until we look at how the Ellipse 4 airframe interacts with the HQW2.0/8. We need to look at the aircraft polar. See excel spreadsheet - attachment 2. For the analysis, I have also assumed that the optimum flap setting is used for the different flight speeds:
Notes: Model weight is assumed to be 2200 g, CD profile is chosen from the best performing flap deflection at the particular CL and Reynolds number. CDi is the induced drag. Cdpara is the parasitic drag(fuselage etc) The aircraft sinking speed polar is shown below:
The aircraft polar for L/D is also shown below:
Summary for Thermal:
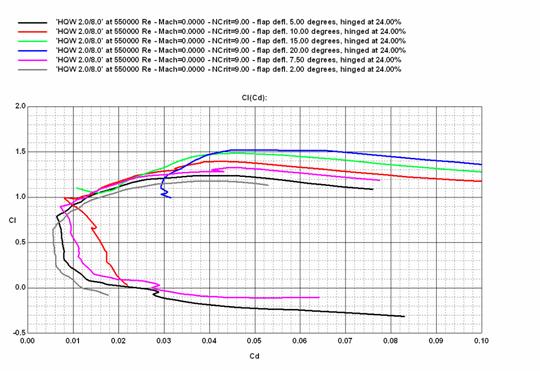
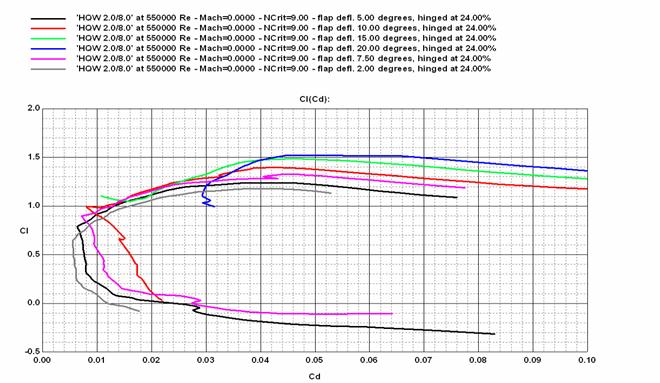
What is the best flap setting for launch? There are essentially two phases to launch – the climb on the line which requires very high CL to produce line tension and store elastic energy before phase two, the conversion of elastic energy into velocity and height (the “ping”). The latter stage requires the same performance parameters as speed, so to set your model up to "ping" well, have a look at the discussion on speed setup. Here we will consider the climbing phase only. Assuming we fly in a 200m arc around the turnaround pulley and arrive above the turnaround pulley in 8 seconds, speed is around 135 km/hr (Reynolds Number 550,000). The towline tension makes the model appear heavier, so the wings have to produce high CL to generate this tension. The higher the tension the better, providing the line retrieval is not too high. Using Profili again:
Polar8: HWQ 2.0-8, Re 120,000, Flap at +2, +5°, +7.5°, +10°, +15° and 20°
To assess the tradeoff, Excel spreadsheet calculations similar to those used for the thermal analysis can be used to look at the model behavior on the launch - attachment 3. In the calculation, varying the towline tension is the same as increasing the model weight, and the sinking speed is analogous to the rate of winch line retrieval:
Notes: Model weight is assumed to be 2200 g, CD is chosen from the best performing flap deflection at the particular CL and Reynolds number. CDi is the induced drag. Cdp is the parasitic drag(fuselage etc) The values for line retrieval can be plotted against the towline tension:
There is a good trade-off between line retrieval and tension below about 50kg tension but above 50kg tension, line retrieval increases.
There may be some benefit to using a heavier flap setting at the very start of the launch as the high drag ensures that the model does not “over-fly” the line, however this aspect has not been included in the analysis.
Summary for Launch:
Conclusions: The theoretical analysis has identified the best flap settings for the various F3b flight modes for the Ellipse 4, and gives a guide on how the real glider may behave with different flap applications. The actual numerical prediction of performance eg minimum sink time, best L/D etc. may not be entirely accurate when compared to the real world, however the insight that this analysis provides on flap setting should prove correct. The intention is that this analysis provides a starting point for setting up the model. The HQW 2.0-8 is a variable camber aerofoil (W in HQW is for Wolbklappe – German for flap). This analysis shows the importance of using the correct camber for each of the flight tasks. The flap deflections serve to broaden the low drag bucket of the polar. This can be shown with a plot of the glider L/D ratio with curves for the best flap setting for each flight speed versus the unflapped state or +2° flap. The coloured bar at the top of the graph shows the recommended flap setting for various speed ranges:
The minimum sinking speed performance of the model can be summarized in the following plot:
1) Excel Spreadsheet to calculate CL, turn diameters and times in turn
2) Excel Spreadsheet to calculate CL, Reynolds number, L/D ratio and sink speed. Example for unballasted, flapped HQW2.0-8
Profili Polars (below) at the Reynolds numbers listed in the spreadsheet above used to determine CD. 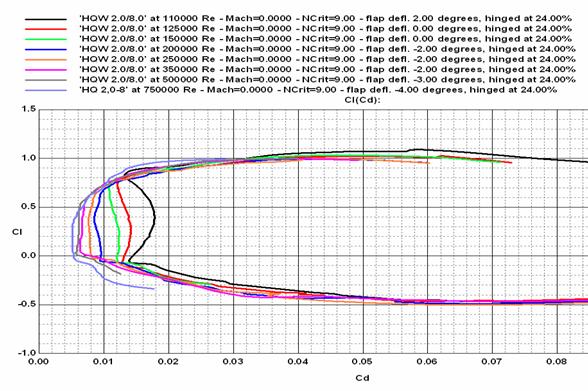 3) Winch line retrieval for various towline tensions. Optimum flap setting used for each value of tension.
|
|||||||||||||||||||||||||||||||||||||||||||||||||||||||||||||||||||||||||||||||||||||||||||||||||||||||||||||||||||||||||||||||||||||||||||||||||||||||||||||||||||||||||||||||||||||||||||||||||||||||||||||||||||||||||||||||||||||||||||||||||||||||||||||||||||||||||||||||||||||||||||||||||||||||||||||||||||||||||||||||||||||||||||||||||||||||||||||||||||||||||||||||||||||||||||||||||||||||||||||||||||||||||||||||||||||||||||||||||||||||||||||||||||||||||||||||||||||||||||||||||||||||||||||||||||||||||||||||||||||||||||||||||||||||||||||||||||||||||||||||||||||||||||||||||||||||||||||||||||||||||||||||||||||||||||||||||||||||||||||||||||||||||||||||||||||||||||||||||||||||||||||||||||||||||||||||||||||||||||||||||||||||||||||||||||||||||||||||||||||||||||||||||||||||||||||||||||||||||||||||||||||||||||||||